

The Migration Monitor |Capital, Trade & Human Mobility | Week of 7th Feb’26
Tracking the world's money, markets, and migration flows
1. Global Liquidity & Capital Flow Signals
The Big Picture: Dollar Weakening, Gold Surging, Capital Rotating Out of the US
The single most important signal in global markets right now is the weakening US dollar. The Dollar Index (DXY) has dropped to ~97.8, down nearly 9.5% over the past 12 months and 4% off its late-2025 highs. This is not a blip — it reflects a structural shift. The US Federal Reserve held rates steady at 3.5–3.75% in January 2026 after three consecutive cuts in 2025, and markets expect further cuts toward 3% by year-end. Two Fed governors even dissented, pushing for another cut immediately.
What this means in plain language: The US is no longer offering the best “interest rate premium” to park your money. Capital that had been sitting in dollar-denominated assets for safety is now looking for better returns elsewhere.
Key developments:
· Gold at near-record levels: $4,910/oz as of Feb 6, up 71.7% year-on-year, with an all-time high of $5,608 in January 2026. Central banks are buying roughly 60 tonnes per month — triple the pre-2022 average. Goldman Sachs has a year-end target of $5,400. This is not speculation — it’s institutional money hedging against fiscal risk and geopolitical uncertainty. · Global equity flows are rotating hard toward Europe and Asia: In the latest week, European equity funds pulled in ~$14 billion (highest since April), Asian funds attracted ~$9 billion, while US funds received only ~$5 billion. The STOXX 600 in Europe hit an all-time high. This is a meaningful shift away from US tech dominance. · Technology is bleeding capital; industrials and commodities are gaining: The tech sector saw $2.03 billion in outflows in a single week, while industrials and metals/mining attracted $2+ billion each. The AI-driven rally has matured — capital is now flowing into the “real economy” sectors that actually build things. · Emerging market equities saw their 7th consecutive week of inflows at $11 billion . This is sustained conviction, not a one-week bounce. EM earnings are projected to grow ~14% in 2026 vs. ~6% for the S&P 500, at significantly lower valuations. · Crude oil at $64/bbl (WTI) , up 14% in the past month but still 10% below a year ago. Goldman Sachs projects average Brent at $56 for 2026 due to surplus supply. Low energy prices are a net positive for India and other energy importers. · Europe’s fiscal revolution: Germany has abandoned decades of fiscal conservatism with a €500 billion+ infrastructure and defence spending plan. The ECB holds rates at 2%. European equities trade at 14.8x earnings — cheaper than the US and with fiscal tailwinds. This is where a significant chunk of institutional capital is headed. · Japan is the outlier: The Bank of Japan hiked rates to 0.75% — a 30-year high — and further hikes are expected. This is compressing carry trades and releasing capital back to Japan. What Type of Capital Is Moving, and Where
2. India-Specific Capital & Business Implications The India Story: FDI Up, FPI Down, Trade Deal Changes Everything
India is experiencing a two-track capital flow pattern that every business owner and investor needs to understand:
Track 1 — FDI is booming: Gross FDI inflows rose 16.1% year-on-year to $64.7 billion during April–November FY26. This is “sticky” capital — factories, offices, technology transfers. It reflects global confidence in India’s structural growth story (GDP projected at 6.8–7.2% for FY26).
Track 2 — FPI is fleeing equities: Foreign Portfolio Investors pulled out a net $7.5 billion from Indian equities in FY26 (Apr–Feb), though they put $1.7 billion into Indian debt. FPI holdings in Indian equities have fallen to a 13-year low of 16.7%. The reasons: India’s high Buffett Ratio (~125% vs. 90% long-term average), rupee weakness, and AI-related capital being redirected to Taiwan, Korea, and the US.
But this is not all bad news. Domestic institutional investors (DIIs) now hold 18.3% of the market — a record — and are providing a strong floor for Indian equities. The Sensex is around 83,580, up 7.35% year-on-year despite the FPI exit.
The US-India Trade Deal: A Game-Changer
This is arguably the most consequential development for Indian business in 2026. On February 5–7, the US and India announced an interim trade framework with these key terms:
· US reciprocal tariff on Indian goods reduced to 18% from the punitive 25%+ that was in place since August 2025 · The additional 25% punitive tariff (imposed for India buying Russian oil) removed effective February 7, 2026 · India commits to purchase $500 billion of US goods over 5 years — energy, aircraft, tech (including GPUs), precious metals, coking coal · India to reduce/eliminate tariffs on US industrial goods and agricultural products · Both countries to expand trade in semiconductors, data centre equipment, and nuclear power technology · Supply chain alignment against “non-market policies of third parties” (read: China) · India gets a preferential tariff-rate quota for auto parts
At 18%, India now has a more competitive tariff rate than Vietnam (20%), Bangladesh (20%), and China (30–35%). This is a structural advantage that could redirect billions in export orders toward Indian manufacturers.
Sectors that benefit immediately:
· Textiles and apparel (thin margins, tariff-sensitive) · Gems, diamonds, and jewellery · Generic pharmaceuticals (pending Section 232 investigation) · Leather and footwear · Engineering goods and machinery
Sectors that face new competition from US imports:
· Agricultural commodities (tree nuts, soybean oil, processed fruits) · Wine and spirits · ICT goods and medical devices (non-tariff barriers being addressed) Rupee, Inflation & RBI Policy · INR at 90.62/USD , recovering from an all-time low of 92.29 in late January. The trade deal should provide near-term stabilization. · RBI held repo at 5.25% in February after cutting 125 basis points through 2025. Inflation is well-controlled at ~2.0–2.6%, within the 2–6% target band. More cuts are possible but the RBI is watching the rupee and global developments. · India 10Y bond yield at 6.70% — under pressure from record government borrowing (₹17.2 trillion gross for FY27). The RBI has been buying bonds aggressively (₹1 trillion in two tranches) to ease liquidity strain. · Forex reserves at ~$701–709 billion — a strong buffer, though the RBI has been intervening to defend the rupee. Budget 2026-27: Where the Government Is Directing Capital
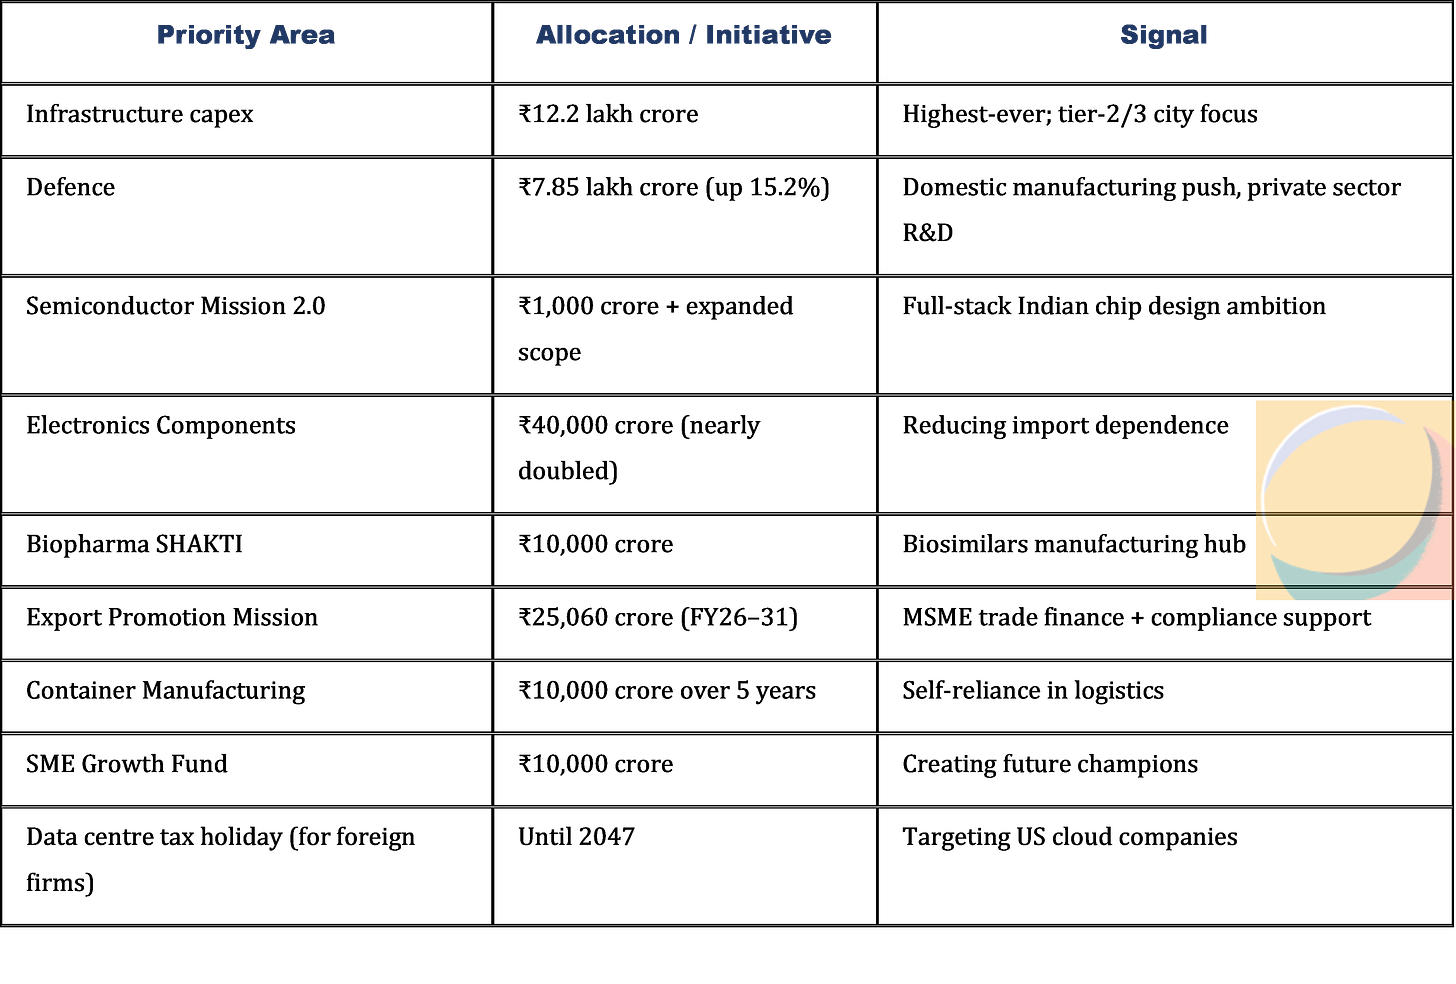
The Union Budget for FY27 sends clear signals about where India’s capital allocation priorities lie:
Key MSME-specific wins:
· ₹10 lakh cap on courier-based exports removed — D2C brands in handicrafts, fashion, auto parts, and Ayurveda products can now ship higher-value orders globally with fewer hurdles · Interest subvention of 2.75% on export credit for MSMEs, with incentives for exports to emerging markets · Collateral guarantee support covering up to 85% for micro/small exporters (up to ₹10 crore per year) · Export realization period extended from 9 to 15 months by RBI — easing cash flow for exporters with longer payment cycles · TCS on overseas tour packages reduced from 5%/20% to a flat 2% 3. Global Business Mobility, Migration & Visa Signals Capital Is Tightening Its Borders — Treat Migration as a Capital Allocation Decision
Every major developed economy is making it harder and more expensive to enter. This is not random — it’s a coordinated response to housing crises, labour market pressures, and political sentiment. For Indian families and businesses, the implication is clear: you must plan earlier, spend more, and be more strategic about jurisdictional choices.
Australia (Tightening — Significant)
· From February 2, 2026: sweeping reforms to end “visa hopping.” Stricter English-language thresholds, shorter overstay tolerance, restrictions on switching between visitor/student/work visas onshore · Expected to reduce temporary visa numbers by 85,000 in the next 12 months · Employers must meet higher salary benchmarks and undergo more frequent compliance audits · Graduates get shorter post-study work rights unless on the critical skills list · Signal: Australia is closing the “study-to-stay” pathway for low-skilled routes. Only high-value migration (critical skills, well-paid roles) is welcome.
United Kingdom (Tightening — Severe)
· English requirement raised from B1 to B2 for Skilled Worker and related visas (effective January 2026) · Path to permanent settlement may extend to 10 years (from 5), with lower-skilled workers facing up to 15 years · Electronic Travel Authorization (ETA) required from February 25, 2026, for citizens of 85 countries including the US, Canada, and Australia · Graduate visa to be cut from 2 years to 18 months (from January 2027) · Signal: The UK is making settlement extremely difficult for anyone below high-skilled professional level. This effectively prices out many mid-tier migration pathways.
Canada (Tightening — Structural Reset)
· Permanent resident target for 2026: 380,000 — down from 483,000 in 2024 · Start-Up Visa programme frozen to new applicants as of January 1, 2026 · Study permit caps introduced, though Master’s/PhD students at public institutions are exempted · Ontario now bans “Canadian work experience” requirements in job postings · Signal: Canada is moving from quantity to quality — high-skilled, French-speaking, or Canada-experienced applicants are preferred. The entrepreneurial immigration route is essentially closed until a replacement programme launches.
United States (Expensive — Rewarding Wealth Over Skills)
· H-1B visa fee increased to $100,000 per application — effectively pricing out smaller employers and making it uneconomical for many tech workers · EB-5 investor visa: $800,000 minimum for targeted employment areas, $1.05 million otherwise · New “Gold Card” programme: $1 million individual / $2 million business gift to the US government — aligned with EB-1A/EB-2 categories · EB-5 programme sunsets September 2027, creating urgency for filing in 2026 · Signal: The US is unmistakably shifting toward capital-based immigration. If you have money, doors are open. If you rely on employer sponsorship, the path is narrower and more expensive.
GCC (Opening — Strategic)
· The GCC Unified Visa (”Gulf Schengen”) pilot launched in late 2025 between UAE and Bahrain, with full rollout across all six GCC states targeted for 2026 · Saudi Arabia tightening business visas from UAE, pushing companies to set up Saudi HQs and hire locally · Saudi Premium Residency: real estate route requires SAR 4 million ($1M) property; business route requires SAR 7 million ($1.9M) investment + 10 Saudi employees · Signal: The GCC is simultaneously becoming easier to travel across (unified visa) but harder to stay permanently without substantial investment. Saudi Arabia is actively pulling corporate headquarters away from Dubai. Reading This as Capital Movement
4. Trade, Supply Chain & Geo-Economic Shifts China+1 Has Become China+N — India Is Winning, But Must Execute
The “China Plus One” strategy — where companies maintain Chinese production but add a second country — has evolved into a multi-node, distributed manufacturing model. Companies are now setting up in 3–4 countries simultaneously.
India’s competitive position in this shift:
At 18% US tariff rate, India now undercuts Vietnam (20%), Bangladesh (20%), and China (30–35%) for access to the world’s largest consumer market. This is the single biggest improvement in India’s trade competitiveness in recent memory.
The government’s budget and policy actions are directly aligned with capturing this opportunity:
· PLI schemes across 14 sectors have attracted ₹2+ lakh crore in actual investment and generated ₹18.7 lakh crore in incremental production. · 10 semiconductor units approved under India Semiconductor Mission with ₹1.6 lakh crore in investment commitments · Electronics production has surged from ₹1.9 lakh crore (FY15) to ₹11.3 lakh crore (FY25) — a 6x increase in a decade · Container Manufacturing Scheme (₹10,000 crore) addresses a critical logistics bottleneck — India currently imports most of its shipping containers
Key supply chain corridors gaining relevance for India:
· India–US: Massively strengthened by the trade deal. Expect increased flows of tech products (GPUs, data centre equipment), energy, and manufactured goods in both directions · India–GCC: The unified visa and Saudi’s RHQ mandate create new logistics and services corridors · India–EU: India is actively negotiating FTAs with the EU and individual European nations. Germany’s infrastructure boom could create demand for Indian engineering and IT services. · India–Southeast Asia: Vietnam remains a competitor, but India’s tariff advantage now makes it more attractive for US-bound production
Early signals to watch:
· Foxconn continues shifting assembly lines to India and Mexico · Apple’s supply chain diversification into India is deepening · Chemical parks being set up in India (3 dedicated parks announced in budget) to reduce dependence on Chinese chemical imports · Rare Earth Corridors being developed — critical for defence, electronics, and clean energy
Risk factor: India’s upstream component supply chain still lags. Much of the “China+N” diversification involves final assembly moving to India while components still come from China. True supply chain independence requires execution on the semiconductor, electronics components, and chemical park initiatives.
- Sectoral Rotation & Second-Order Effects Where Capital Is Flowing — and Where Smart Advisors Should Position
Sectors with strong tailwinds (capital flowing in):
· Defence & Aerospace: ₹7.85 lakh crore budget allocation (15.2% increase), private sector R&D funding for the first time, 75% domestic procurement mandate. The US defence sector saw stocks surge 53.5% in 2025. Indian defence startups attracted $711 million in cumulative equity funding. Second-order beneficiaries: compliance advisory, defence-tech consulting, testing and certification services. · Semiconductors & Electronics: India Semiconductor Mission 2.0, Electronics Components scheme at ₹40,000 crore, 10 approved fab/packaging units. Second-order beneficiaries: environmental compliance, construction/infrastructure for fab sites, workforce training and placement. · Infrastructure & Real Estate: ₹12.2 lakh crore capex, focus on tier-2/3 cities, Infrastructure Risk Guarantee Fund for private developers, $5–7 billion in annual institutional real estate investment expected. Second-order beneficiaries: project management consulting, logistics, land advisory, urban planning. · Clean Energy & Nuclear: Zero customs duty on nuclear equipment until 2035, battery energy storage incentives, solar manufacturing PLI with 65 GW capacity target. Second-order beneficiaries: regulatory consulting, environmental impact assessment, engineering services. · Gold & Precious Metals: Up 71.7% YoY, central banks and HNI families are structural buyers. Second-order beneficiaries: wealth advisory, gems and jewellery exporters (tariff-exempted under India-US deal). · Digital Payments & Fintech: Global market projected to reach $1+ trillion by 2032, India leads in UPI adoption. Second-order beneficiaries: compliance/AML advisory, payment infrastructure consulting.
Sectors under pressure (capital flowing out or margins compressing):
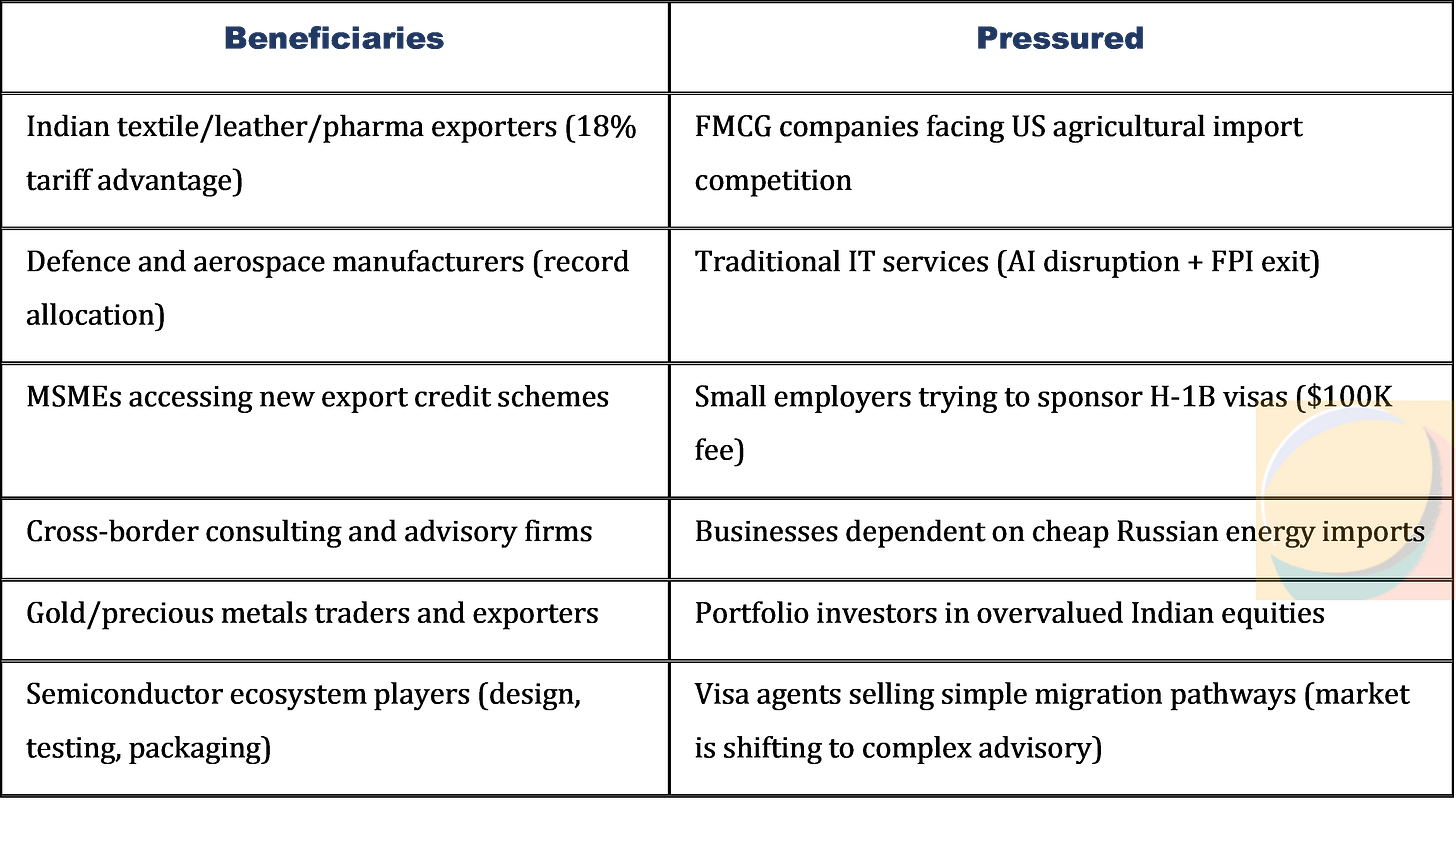
· IT Services (Traditional): FPI outflows from Indian IT stocks, STT increase in budget dampening market liquidity. The sector is being disrupted by AI — legacy services contracts are under renegotiation pressure. · FMCG: Broad-based FPI selling across consumer sectors, slowing rural demand, and new competition from US agricultural imports (soybean oil, processed fruits) under the trade deal. · Oil & Gas (Upstream): Crude at $64/bbl with Goldman forecasting average $56 for 2026 and long-term surplus. India’s commitment to reduce Russian oil purchases will shift sourcing to more expensive US/Venezuelan crude. · Real Estate (Premium Urban): While tier-2/3 cities benefit from infrastructure push, premium urban markets face elevated interest rates and FPI-linked demand weakness. Summary: Where to Focus Attention This Month Top 5 Signals (Not Noise) 1. The US-India 18% tariff deal is the defining event. It restructures India’s export competitiveness overnight. Every exporter, manufacturer, and trade-linked business needs to re-evaluate pricing, market strategy, and supply chain positioning immediately. 2. The dollar is in a structural weakening trend. At 97.8 and projected to drop to ~95 by year-end, this affects everything from the rupee to export realisations to the relative cost of international expansion. 3. Gold above $4,900 is a signal of deep institutional risk-hedging , not speculation. Central banks and wealthy families are de-dollarising. This creates opportunities in precious metals advisory and gems/jewellery exports. 4. Immigration is being repriced globally. The era of “affordable” migration is ending. Australia (-85K visas), UK (10-year settlement), Canada (380K target), US ($100K H-1B) — every pathway is narrower and more expensive. This is a massive advisory opportunity. 5. India’s budget is directing capital toward manufacturing self-reliance — semiconductors, defence, chemicals, containers, electronics, biopharma. The government is putting ₹12.2+ lakh crore of taxpayer money behind these bets. Second-order businesses (training, compliance, consulting, logistics) will benefit. Who Benefits / Who Is Pressured
Early Indicators to Watch Over the Next 30 Days · India-US interim agreement text finalisation — the framework is announced, but the binding legal text will determine actual tariff implementation timelines · RBI’s next liquidity injection moves — projected to push liquidity to ₹2.4 trillion by March, which will ease credit conditions for MSMEs · FPI flow direction in February — if the trade deal stabilises sentiment, we could see the first sustained FPI inflow month in several quarters · US-Iran negotiations outcome — failure could spike oil prices and disrupt India’s energy import strategy · Gold price action above/below $5,000 — sustained levels above $5,000 would confirm structural de-dollarisation, with implications for India’s gems/jewellery exports and reserve management
Disclaimer
Kirtiraj Gohil is a Management Consultant and Founder of Blue Mango Consulting Group. This article is provided for informational purposes only and does not constitute investment, financial, legal, or professional advice of any kind.
Readers must conduct independent analysis and exercise due diligence before making investment or business decisions. The author and Blue Mango Consulting Group assume no liability for decisions made based on this content.
Information herein is derived from institutional-grade sources, including Reuters, Trading Economics, White House statements, Reserve Bank of India policy releases, NSDL FPI data, LSEG Lipper fund flow data, India Brand Equity Foundation, Press Information Bureau releases, PwC/KPMG analyses, and research from Goldman Sachs, JP Morgan Asset Management, Morgan Stanley, and Franklin Templeton. While accuracy is prioritized, no warranty is made regarding completeness or timeliness.
Past performance does not guarantee future results. All investments involve risk. Consult qualified professionals before taking action.